Customizing Playback Information Display
You can specify screens and accompanying information displayed during image playback.
-
Select [
 : Playback information display].
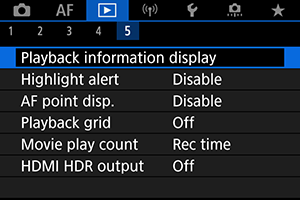
-
Add a checkmark [
 ] next to the number of screens to display.
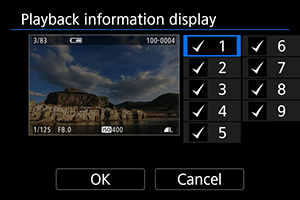
- Select numbers with the
 dial.
dial. - Press the
 button to clear a checkmark []. Press it again to add a checkmark [].
 - Repeat these steps to add a checkmark [] to the number of each screen to display, then select [OK].
- Your selected information can be accessed by pressing the
 button during playback, or by using
  when shooting information is displayed.
- Select numbers with the
Histogram
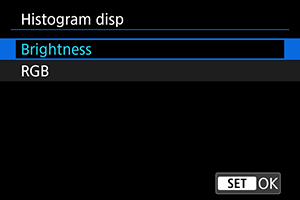
The histograms show signal levels across the tonal range. Brightness display (for checking the general exposure level and overall gradation) and RGB display (for checking saturation and gradation of red, green, and blue) are available. You can switch the histogram displayed by pressing the ![]() button when [
button when [![]() ] is displayed in the lower left of the [
] is displayed in the lower left of the [![]() : Playback information display] screen.
: Playback information display] screen.
-
[Brightness] display
This histogram is a graph showing the distribution of the image's brightness level, with the horizontal axis indicating the brightness level (darker on the left and brighter on the right) and the vertical axis indicating the pixel count at each brightness level. The more pixels there are toward the left, the darker the image, and the more pixels there are toward the right, the brighter the image. If there are too many pixels on the left, detail in shadows will be lost, and if there are too many pixels on the right, detail in highlights will be lost. The gradation in-between will be reproduced. By checking the image and its brightness histogram, you can see the exposure level inclination and the overall gradation.
Sample histograms
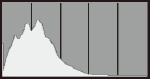
Dark image
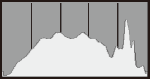
Normal brightness
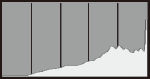
Bright image
-
[RGB] display
This histogram is a graph showing the distribution of each primary color's brightness level in the image (RGB or red, green, and blue), with the horizontal axis indicating the color's brightness level (darker on the left and brighter on the right) and the vertical axis indicating the pixel count at each color brightness level. The more pixels there are toward the left, the darker and less prominent the color, and the more pixels there are toward the right, the brighter and denser the color. If there are too many pixels on the left, the corresponding color information will be lacking, and if there are too many pixels on the right, the color will be too saturated, without gradation. By checking the image's RGB histogram, you can see the color's saturation and gradation conditions, as well as the white balance bias.